Advertisements
Advertisements
प्रश्न
Multiple choice Question. Select the correct option.
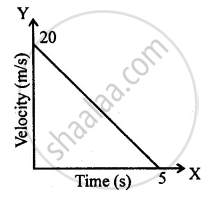
In the velocity-time graph, the acceleration is
विकल्प
– 4 m/s2
4 m/s2
10 m/s2
zero
Advertisements
उत्तर
– 4 m/s2
Explanation:
Acceleration = Slope of velocity-time graph
a = `-20/5` .....[∵ Velocity is decreasing with time]
a = −4 m/s2 ........[∴ Acceleration will be negative]
APPEARS IN
संबंधित प्रश्न
Name the two quantities, the slope of whose graph give acceleration.
What does the slope of a displacement-time graph represent?
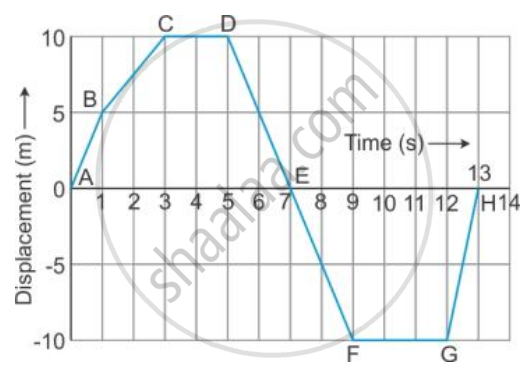
From the displacement-time graph of a cyclist given below in the Figure, find The time after which he reaches the starting point .
From the diagram given below, calculate distance covered by body.
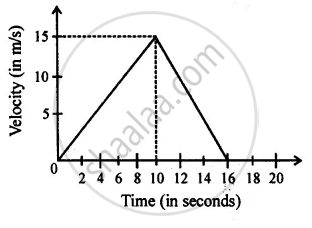
Diagram is given below shows velocity – time graph of car P and Q, starting from the same place and in the same direction. Calculate which car is ahead after 10 s and by how much?

Given on th e side are a few speed - time graphs for various objects moving along a stra ight line. Refer below figure. (a), (b), (c) and (d).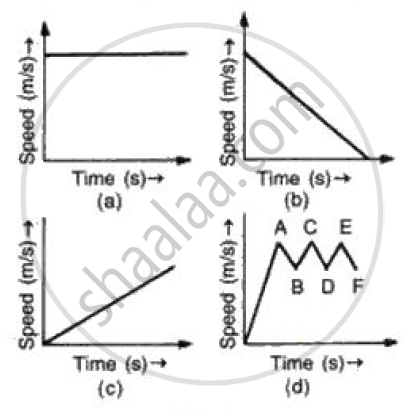
Which of these graphs represent
(a) Uni form motion
(b) Motion with speed increasing
(c) Motion with speed decreasing and
(d) Motion with speed oscillating.?
What can you conclude if the speed-time graph of a body is a curve moving upwards starting from the origin?
What can you conclude if the speed-time graph of a body is a straight line sloping upwards and not passing through the origin?
Draw velocity-time graph to show:
Deceleration
Write a sentence to explain the shape of graph.
What does the slope of velocity-time graph represent?
