Advertisements
Advertisements
प्रश्न
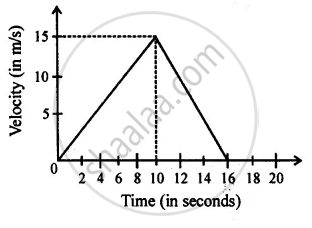
From the diagram given below, calculate distance covered by body.
Advertisements
उत्तर

Distance covered = area under v.t. graph
= area of ΔOAC + area of ΔABC
= `1/2xx"OC"xx"AC"+1/2xx"BC"xx"AC"`
= `1/2xx10xx15+1/2xx6xx15`
= 5 × 15 + 3 × 15
= 75 + 45
= 120 m
APPEARS IN
संबंधित प्रश्न
A body with an initial velocity x moves with a uniform acceleration y. Plot its velocity-time graph.
Study the speed-time graph of a car given alongside and answer the following questions:
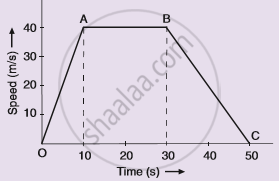
(i) What type of motion is represented by OA ?
(ii) What type of motion is represented by AB ?
(iii) What type of motion is represented by BC ?
(iv) What is the acceleration of car from O to A ?
(v)What is the acceleration of car from A to B ?
(vi) What is the retardation of car from B to C ?
Define speed. What is its S.I. unit?
What does the area of an acceleration – time graph represent?
A train starting from rest picks up a speed of 20 ms−1 in 200 s. It continues to move at the same rate for the next 500 s and is then brought to rest in another 100 s.
- Plot a speed-time graph.
- From graph calculate
(a) uniform rate of acceleration
(b) uniform rate of retardation
(c) total distance covered before stopping
(d) average speed.
Interpret the following graph: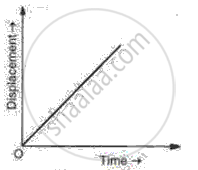
What can you say about the motion of a body if:
Its time-velocity graph is a straight line
Draw distance-time graph to show:
Decreasing velocity
Derive the equation
S = ut+ `1/2` at2
Using a speed- time graph
The area of the velocity-time graph gives the displacement of the body.
