Advertisements
Advertisements
प्रश्न
Diagram is given below shows velocity – time graph of car P and Q, starting from the same place and in the same direction. Calculate which car is ahead after 10 s and by how much?

Advertisements
उत्तर

Distance covered by car P = area of ΔOAB
= `1/2xx"OB"xx"AB"`
= `1/2xx10xx35`
= 175 m
Distance covered by car Q = area of ΔCDE + area of rectangle DFBE
= `1/2xx"CE"xx"DE"+"EB"xx"BF"`
= `1/2xx(5-2)xx25+(10-5)xx25`
= `75/2+125`
= 37.5 + 125
= 162.5 m
So, car P is a head of car Q by (175 − 162.5) m
i.e. by 12.5 m
APPEARS IN
संबंधित प्रश्न
For uniform motion _________
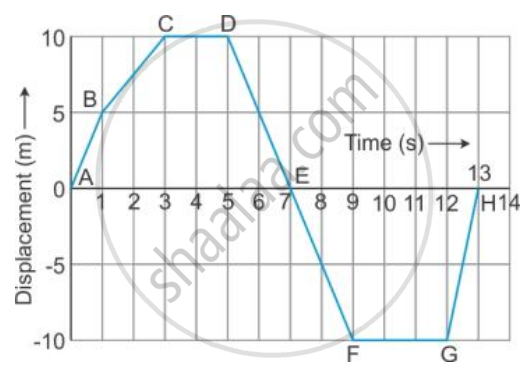
From the displacement-time graph of a cyclist given below in the Figure, find The time after which he reaches the starting point .
Multiple choice Question. Select the correct option.
In the velocity-time graph, the acceleration is
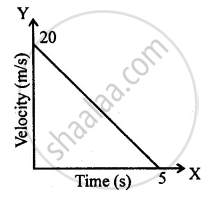
Diagram shows a velocity – time graph for a car starting from rest. The graph has three sections AB, BC, and CD.

Is the magnitude of acceleration higher or lower than that of retardation? Give a reason.
The area of the right triangle under a speed-time graph is 500 m, in a time interval of 20 s. What is the speed of the body? Is the motion uniform or non-uniform?
Draw the following graph:
Speed versus time for a non-uniform acceleration.
Draw the following graph:
Distance versus time for a body at rest.
Interpret the following graph:
Figure shows the distance-time graph of three students A, B and C. On the basis of the graph, answer the following :
How far did B travel between the time he passed C and A?
Which of the following can determine the acceleration of a moving object.
