Advertisements
Advertisements
प्रश्न
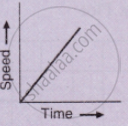
The slope of the speed–time graph gives ______.
Advertisements
उत्तर
The slope of the speed–time graph gives acceleration.
Explanation:
Acceleration is the rate of change of velocity over time. Since speed is the magnitude of velocity, a speed-time graph essentially shows how the speed of an object changes with time. The slope of this graph, which is the change in speed divided by the change in time, thus indicates the acceleration of the object.
APPEARS IN
संबंधित प्रश्न
The velocity-time graph for part of a train journey is a horizontal straight line. What does this tell you about the trains velocity.
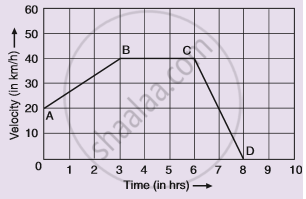
Given alongside is the velocity-time graph for a moving body :
Find :
(i) Velocity of the body at point C.
(ii) Acceleration acting on the body between A and B.
(iii) Acceleration acting on the body between B and C.
What type of motion is represented by the following graph ?
For uniform motion _________
Given on th e side are a few speed - time graphs for various objects moving along a stra ight line. Refer below figure. (a), (b), (c) and (d).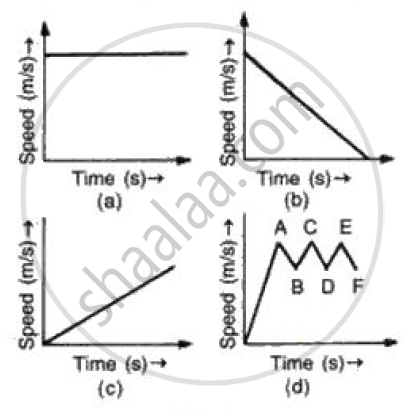
Which of these graphs represent
(a) Uni form motion
(b) Motion with speed increasing
(c) Motion with speed decreasing and
(d) Motion with speed oscillating.?
Draw the following graph:
Distance versus time for a body at rest.
Draw the following graph:
Speed versus time for a fluctuating speed.
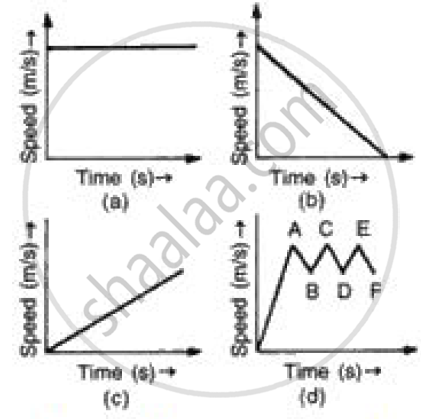
(i) In speed time graph uniform motion is given by a straight line parallel to x axis so figure (a) denotes the uniform motion.
(ii) In speed time graph motion with increasing speed is shown by straight line with positive slope so figure (c) denotes the motion with speed increasing.
(iii) In speed time graph motion with decreasing speed is shown by straight line with negative slope so figure (b) denotes the motion with speed decreasing.
(iv) In speed time graph motion with oscillating speed is shown by zigzag line so figure {d) denotes the motion with speed oscillating.
State whether true or false. If false, correct the statement.
If the velocity – time graph of a particle is a straight line inclined to X-axis then its displacement – time graph will be a straight line.
A straight line parallel to the x-axis in the velocity-time graph represents the object moving in ______.
