Advertisements
Advertisements
Question
The slope of the speed–time graph gives ______.
Advertisements
Solution
The slope of the speed–time graph gives acceleration.
Explanation:
Acceleration is the rate of change of velocity over time. Since speed is the magnitude of velocity, a speed-time graph essentially shows how the speed of an object changes with time. The slope of this graph, which is the change in speed divided by the change in time, thus indicates the acceleration of the object.
APPEARS IN
RELATED QUESTIONS
The velocity-time graph for part of a train journey is a horizontal straight line. What does this tell you about the trains velocity.
The velocity-time graph for part of a train journey is a horizontal straight line. What does this tell you about its acceleration ?
Derive the following equation of motion by the graphical method : v2 = u2 + 2as, where the symbols have their usual meanings.
Study the speed-time graph of a car given alongside and answer the following questions:
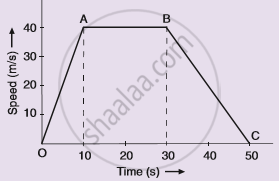
(i) What type of motion is represented by OA ?
(ii) What type of motion is represented by AB ?
(iii) What type of motion is represented by BC ?
(iv) What is the acceleration of car from O to A ?
(v)What is the acceleration of car from A to B ?
(vi) What is the retardation of car from B to C ?
What does the slope of velocity-time graph represent?
From the velocity – time graph given below, calculate acceleration in the region AB.

How does the slope of a speed-time graph give the acceleration of a body moving along a straight line?
Draw the following graph:
Speed versus time for a fluctuating speed.
Draw velocity-time graph to show:
Zero acceleration
Write a sentence to explain the shape of graph.
Derive the equation
S = ut+ `1/2` at2
Using a speed- time graph
