Advertisements
Advertisements
Question
Draw velocity-time graph to show:
Zero acceleration
Write a sentence to explain the shape of graph.
Advertisements
Solution

As slope of velocity time graph gives acceleration. So motion with zero acceleration is represented by line having zero zero slope with time axis or a line parallel to the time axis.
APPEARS IN
RELATED QUESTIONS
Fill in the following blank with suitable word :
In a speed-time graph, the area enclosed by the speed-time curve and the time axis gives the…………….. by the body.
A body with an initial velocity x moves with a uniform acceleration y. Plot its velocity-time graph.
Study the speed-time graph of a car given alongside and answer the following questions:
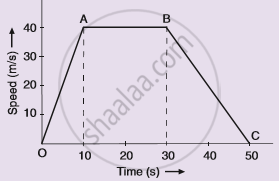
(i) What type of motion is represented by OA ?
(ii) What type of motion is represented by AB ?
(iii) What type of motion is represented by BC ?
(iv) What is the acceleration of car from O to A ?
(v)What is the acceleration of car from A to B ?
(vi) What is the retardation of car from B to C ?
Diagram shows a velocity – time graph for a car starting from rest. The graph has three sections AB, BC and CD.

Compare the distance travelled in section BC with the distance travelled in section AB.
Diagram shows a velocity – time graph for a car starting from rest. The graph has three sections AB, BC, and CD.
In which section, car has a zero acceleration?
A train starting from rest picks up a speed of 20 ms−1 in 200 s. It continues to move at the same rate for the next 500 s and is then brought to rest in another 100 s.
- Plot a speed-time graph.
- From graph calculate
(a) uniform rate of acceleration
(b) uniform rate of retardation
(c) total distance covered before stopping
(d) average speed.
Draw the following graph:
Speed versus time for a stepped motion
Interpret the following graph: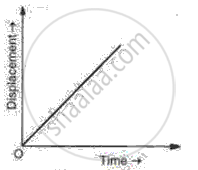
What does the slope of speed-time graph indicate?
Draw distance-time graph to show:
Uniform velocity
