Advertisements
Advertisements
Question
Draw velocity-time graph to show:
Acceleration
Write a sentence to explain the shape of graph.
Advertisements
Solution
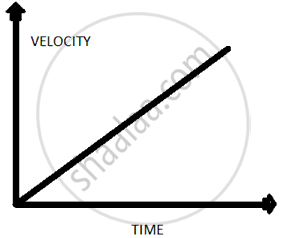
Acceleration is represented by a line on a velocity time graph with a positive slope with time axis.
APPEARS IN
RELATED QUESTIONS
A body with an initial velocity x moves with a uniform acceleration y. Plot its velocity-time graph.
A body is moving uniformly in a straight line with a velocity of 5 m/s. Find graphically the distance covered by it in 5 seconds.
What type of motion is represented by the following graph ?
For uniform motion _________
From the velocity – time graph given below, calculate Average velocity in region CED.

Draw distance-time graph to show:
Increasing velocity
Figure shows the distance-time graph of three students A, B and C. On the basis of the graph, answer the following :
How far did B travel between the time he passed C and A?
Saphira moves at a constant speed in the same direction. Rephrase the same sentence in fewer words using concepts related to motion.
Which of the following can determine the acceleration of a moving object.
If the velocity-time graph has the shape AMB, what would be the shape of the corresponding acceleration-time graph?

