Advertisements
Advertisements
प्रश्न
Draw velocity-time graph to show:
Acceleration
Write a sentence to explain the shape of graph.
Advertisements
उत्तर
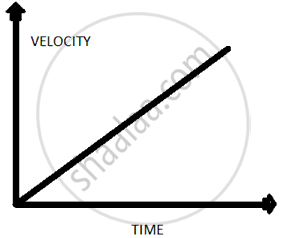
Acceleration is represented by a line on a velocity time graph with a positive slope with time axis.
APPEARS IN
संबंधित प्रश्न
Show by using the graphical method that: `s=ut+1/2at^2` where the symbols have their usual meanings.
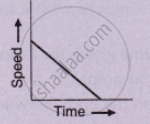
What type of motion is represented by the following graph ?
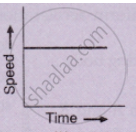
What type of motion is represented by the following graph ?
A car of mass 1000 kg is moving with a velocity of 10 m s−1. If the velocity-time graph for this car is a horizontal line parallel to the time axis, then the velocity of car at the end of 25 s will be :
Define speed. What is its S.I. unit?
From the velocity – time graph given below, calculate Distance covered in the region ABCE.

Draw distance-time graph to show:
Increasing velocity
The area under the v-t graph represents a physical quantity that has the unit.
From the v-t graph, ______ can be calculated.
The area of the velocity-time graph gives the displacement of the body.
