Advertisements
Advertisements
प्रश्न
Draw distance-time graph to show:
Increasing velocity
Advertisements
उत्तर
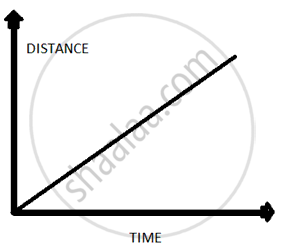
As slope of a distance time graph indicates velocity so a increasing velocity means a straight line having a positive slope with time axis.
APPEARS IN
संबंधित प्रश्न
Name the two quantities, the slope of whose graph give acceleration.
The velocity-time graph for part of a train journey is a horizontal straight line. What does this tell you about the trains velocity.
Draw velocity – time graph for the following situation:
When a body, is moving with uniform velocity.
Draw the following graph:
Speed versus time for a stepped motion
Draw the following graph:
Speed versus time for a fluctuating speed.
Draw the following graph:
Speed versus time for a uniformly retarded motion.
What does the slope of speed-time graph indicate?
Interpret the following graph: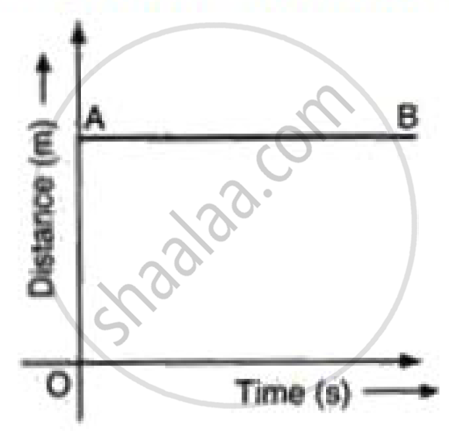
Figure shows the distance-time graph of three students A, B and C. On the basis of the graph, answer the following :
Will the three ever meet at any point on the road?
Saphira moves at a constant speed in the same direction. Rephrase the same sentence in fewer words using concepts related to motion.
