Advertisements
Advertisements
प्रश्न
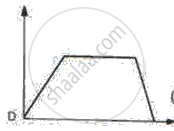
Interpret the following graph: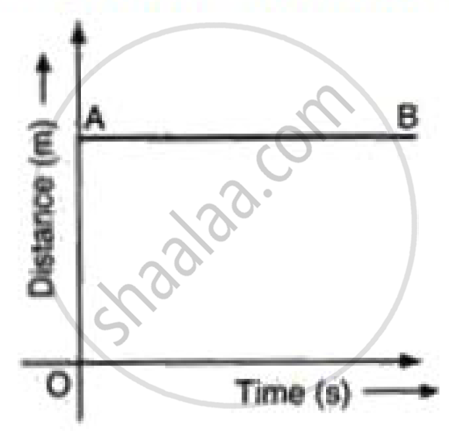
Advertisements
उत्तर
In distance time graph a straight line parallel to time axis represents state of motion.
APPEARS IN
संबंधित प्रश्न
From the velocity – time graph given below, calculate Average velocity in region CED.

Diagram is given below shows velocity – time graph of car P and Q, starting from the same place and in the same direction. Calculate which car is ahead after 10 s and by how much?

The area under a speed-time graph in a given intervals gives the total distance covered by a body irrespective of its motion being uniform or non-uniform.
How will you use a speed-time graph to find whether the acceleration of the body is uniform or not?
Draw the following graph:
Distance versus time for a body at rest.
Given below are the speed -time graphs. Match them with their corresponding motions :
 |
(a) Uniformity retared motion |
 |
(b) Non-uniformity acceleration |
 |
(c) Non-uniform motion |
 |
(d) uniform motion |
Figure shows displacement- time graph of two objects A and B moving in a stra ight line. Which object is moving fa ster?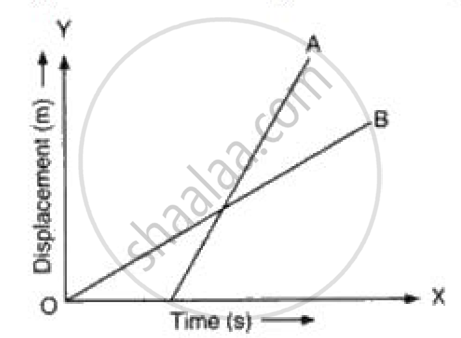
Figure shows the velocity-time graphs for two objects A and B moving in same direction . Which object has the greater a cceleration?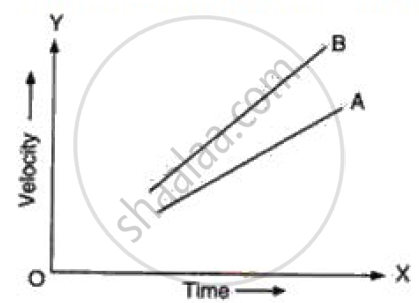
Figure shows the distance-time graph of three students A, B and C. On the basis of the graph, answer the following :
Which of the three is traveling the fastest?
Slope of the velocity-time graph gives ______.
