Advertisements
Advertisements
प्रश्न
Interpret the following graph: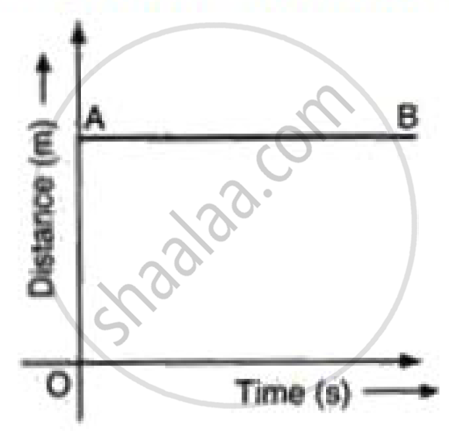
Advertisements
उत्तर
In distance time graph a straight line parallel to time axis represents state of motion.
APPEARS IN
संबंधित प्रश्न
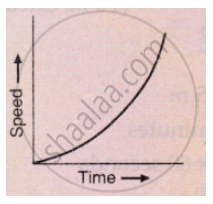
What conclusion can you draw about the acceleration of a body from the speed-time graph shown below .
Name the two quantities, the slope of whose graph give acceleration.
Derive the following equation of motion by the graphical method : v2 = u2 + 2as, where the symbols have their usual meanings.
Draw velocity – time graph for the following situation:
When a body is moving with variable velocity, but uniform acceleration.
From the velocity – time graph given below, calculate Distance covered in the region ABCE.

From the velocity – time graph given below, calculate Average velocity in region CED.
Given on th e side are a few speed - time graphs for various objects moving along a stra ight line. Refer below figure. (a), (b), (c) and (d).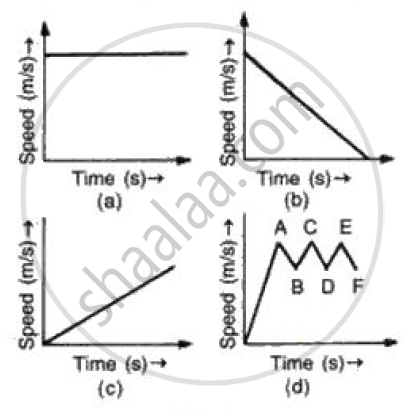
Which of these graphs represent
(a) Uni form motion
(b) Motion with speed increasing
(c) Motion with speed decreasing and
(d) Motion with speed oscillating.?
Draw the following graph:
Speed versus time for a non-uniform acceleration.
Which of the following graphs represents a motion with negative acceleration?
The area of the velocity-time graph gives the displacement of the body.
