Advertisements
Advertisements
प्रश्न
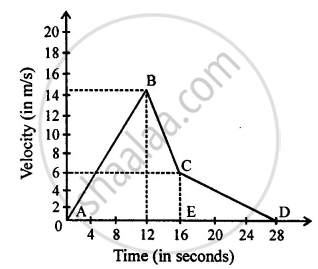
From the velocity – time graph given below, calculate Average velocity in region CED.
Advertisements
उत्तर
Displacement covered in region ΔCDE = area of ΔCDE
= `1/2xx"ED"xx"CE"`
= `1/2xx(28-16)xx6`
= `1/2xx12xx6`
= 36 m
Average velocity in region CED = `"Total displacement"/"Time"`
= `36/12`
= 3 ms−1
APPEARS IN
संबंधित प्रश्न
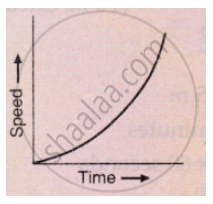
What conclusion can you draw about the acceleration of a body from the speed-time graph shown below .
The velocity-time graph for part of a train journey is a horizontal straight line. What does this tell you about the trains velocity.
Draw a displacement-time graph for a boy going to school with uniform velocity.
Draw displacement – time graph for the following situation:
When a body is stationary.
From the velocity – time graph given below, calculate Distance covered in the region ABCE.
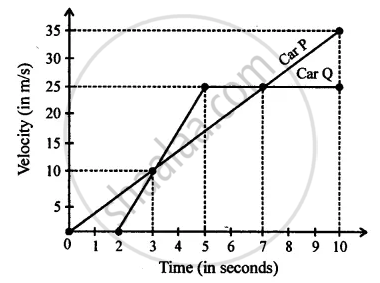
Diagram is given below shows velocity – time graph of car P and Q, starting from the same place and in the same direction. Calculate which car is ahead after 10 s and by how much?
What does the slope of speed-time graph indicate?
What can you say about the motion of a body if:
Its time-velocity graph is a straight line
State whether true or false. If false, correct the statement.
The velocity – time graph of a particle falling freely under gravity would be a straight line parallel to the x axis.
The area of the velocity-time graph gives the displacement of the body.
