Advertisements
Advertisements
प्रश्न
Diagram is given below shows velocity – time graph of car P and Q, starting from the same place and in the same direction. Calculate which car is ahead after 10 s and by how much?

Advertisements
उत्तर

Distance covered by car P = area of ΔOAB
= `1/2xx"OB"xx"AB"`
= `1/2xx10xx35`
= 175 m
Distance covered by car Q = area of ΔCDE + area of rectangle DFBE
= `1/2xx"CE"xx"DE"+"EB"xx"BF"`
= `1/2xx(5-2)xx25+(10-5)xx25`
= `75/2+125`
= 37.5 + 125
= 162.5 m
So, car P is a head of car Q by (175 − 162.5) m
i.e. by 12.5 m
APPEARS IN
संबंधित प्रश्न
What conclusion can you draw about the acceleration of a body from the speed-time graph shown below .
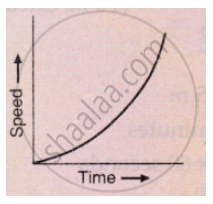
Diagram shows a velocity – time graph for a car starting from rest. The graph has three sections AB, BC and CD.

Compare the distance travelled in section BC with the distance travelled in section AB.
From the diagram given below, calculate distance covered by body.
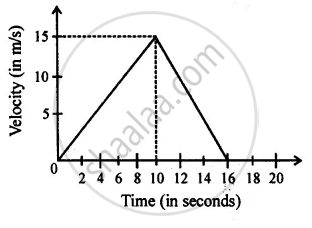
Diagram is given below shows velocity – time graph of car P and Q, starting from the same place and in the same direction. Calculate at what time intervals both cars have the same velocity?
Draw the speed-time graph of a body when its initial speed is not zero and the speed increases uniformly with time.
Draw the speed-time graph of a body starting from some point P, gradually picking up speed, then running at a uniform speed and finally slowing down to stop at some point Q.
Draw the following graph:
Speed versus time for a non-uniform acceleration.
Draw the following graph:
Speed versus time for a fluctuating speed.
Derive the equation
S = ut+ `1/2` at2
Using a speed- time graph
Figure shows the distance-time graph of three students A, B and C. On the basis of the graph, answer the following :
Which of the three is traveling the fastest?
