Advertisements
Advertisements
प्रश्न
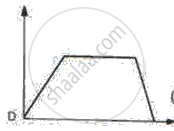
Draw the speed-time graph of a body starting from some point P, gradually picking up speed, then running at a uniform speed and finally slowing down to stop at some point Q.
Advertisements
उत्तर

Speed time graph of a body starting from point P gradually picking up speed, then running at a uniform speed and finally slowing down to stop at some point Q
APPEARS IN
संबंधित प्रश्न
The velocity-time graph for part of a train journey is a horizontal straight line. What does this tell you about its acceleration ?
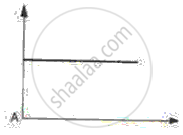
What type of motion is represented by the following graph ?
What type of motion is represented by the following graph ?
Draw displacement – time graph for the following situation:
When a body is stationary.
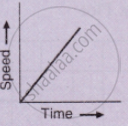
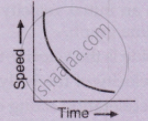
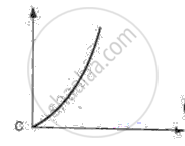
What can you conclude if the speed-time graph of a body is a curve moving upwards starting from the origin?
Interpret the following graph: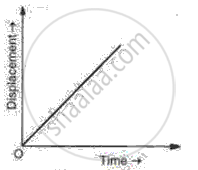
Given below are the speed -time graphs. Match them with their corresponding motions :
 |
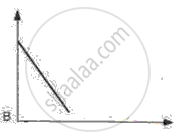
(a) Uniformity retared motion |
 |
(b) Non-uniformity acceleration |
 |
(c) Non-uniform motion |
 |
(d) uniform motion |
Draw distance-time graph to show:
Increasing velocity
Interpret the following graph: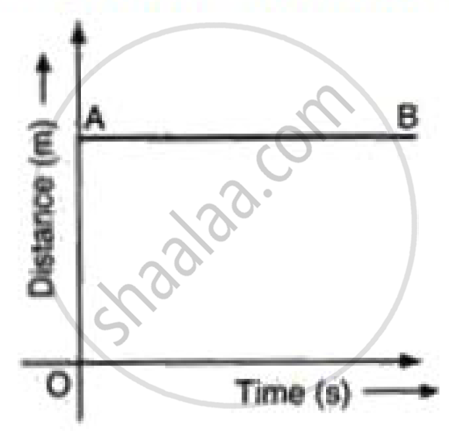
The given graph shows the variation of velocity (v) with position (x) for a particle moving along a straight line
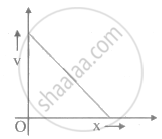
Which of the following graph shows the variation of acceleration (a) with position (x)?
