Advertisements
Advertisements
प्रश्न
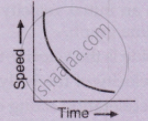
What type of motion is represented by the following graph ?
Advertisements
उत्तर
Graph (d) represents non-uniformly retarding as it has a varying slope.
APPEARS IN
संबंधित प्रश्न
Show by means of graphical method that: v = u + at, where the symbols have their usual meanings.
Derive the following equation of motion by the graphical method : v2 = u2 + 2as, where the symbols have their usual meanings.
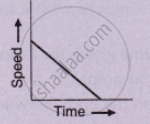
What type of motion is represented by the following graph ?
Define speed. What is its S.I. unit?
What does the area of an acceleration – time graph represent?
Diagram shows a velocity – time graph for a car starting from rest. The graph has three sections AB, BC and CD.
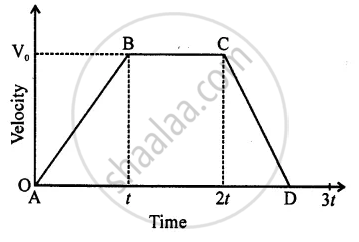
From a study of this graph, state how the distance travelled in any section is determined.
Name the physical quantity which is equal to the area under speed-time graph.
What can you say about the nature of motion of a body of its displacement-time graph is:
A straight line inclined to the time axis with an acute angle?
Draw the distance-time graphs of the bodies P and Q starting from rest, moving with uniform speeds with P moving faster than Q.
The area under the v-t graph represents a physical quantity that has the unit.
