Advertisements
Advertisements
प्रश्न
Show by means of graphical method that: v = u + at, where the symbols have their usual meanings.
Advertisements
उत्तर
Consider the velocity-time graph of a body shown in figure.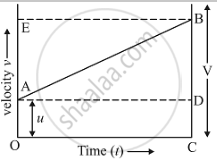
The body has an initial velocity (u) at a point A and then, its velocity changes at a uniform rate from A to B in time, (t). In other words, there is a uniform acceleration (a) from A to B, and after time (t) its final velocity becomes (v) which is equal to BC in the graph. The time (t) is represented by OC. To complete the figure, we draw the perpendicular CB from point C, and draw AD parallel to OC. BE is the perpendicular from point B to OE.
And, final velocity of the body, (v) = BC …… (2)
But from the graph BC = BD + DC
Therefore, v = BD + DC ……(3)
Again DC = OA
So, v = BD + OA
Now, from equation (1),
So, v = BD + u ......(4)
We should find out the value of the slope of a velocity-time graph which is equal to the acceleration,
Thus, Acceleration,
`a = "BD"/"AD"`
But AD = OC = t, so putting t in place of AD in the above relation, we get,
`a = "BD"/t`
So, BD = at
Now, putting this value of BD in equation (4), we get the 1st equation of motion-:
`v = u + at`
where,
(a) - Acceleration
(v) - Final velocity
(u) - Initial velocity
(t) - Time taken
APPEARS IN
संबंधित प्रश्न
What can you say about the motion of a body if its speed-time graph is a straight line parallel to the time axis ?
Show by using the graphical method that: `s=ut+1/2at^2` where the symbols have their usual meanings.
Three speed-time graphs are given below :
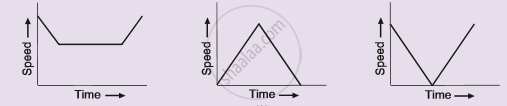
Which graph represents the case of:
(i) a cricket ball thrown vertically upwards and returning to the hands of the thrower ?
(ii) a trolley decelerating to a constant speed and then accelerating uniformly ?
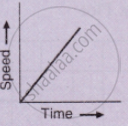
What type of motion is represented by the following graph ?
Define speed. What is its S.I. unit?
Draw a displacement-time graph for a boy going to school with uniform velocity.
For uniform motion _________
Draw the following graph:
Distance versus time for a body at rest.
Draw velocity-time graph to show:
Acceleration
Write a sentence to explain the shape of graph.
From the v-t graph, ______ can be calculated.
