Advertisements
Advertisements
प्रश्न
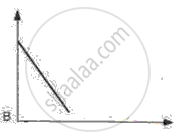
A ball is thrown up vertically and returns back to thrower in 6 s. Assuming there is no air friction, plot a graph between velocity and time. From the graph calculate
- deceleration
- acceleration
- total distance covered by ball
- average velocity.
Advertisements
उत्तर
A ball is thrown up vertically and returns to thrower in 6s. It means the ball takes 3s to reach the highest point and 3s to reach the earth from the highest point.

For the upward motion of a ball
u = ?
v = 0
a = −g = −10 ms−2
t = 3s
v = u + at
0 = u − 10(3)
u = 30 m/s
⇒ In the graph, OA = CD = 30 m/s
(i) When the ball moves upwards, then it decelerates.
From graph, deceleration = − slope of graph AB
= `-"OA"/"OB"=-30/3` = −10 ms−2
(ii) When ball falls downwards then acceleration = Slope of v.t. graph BC
= `"CD"/"BD"=30/3` = 10 ms−2
(iii) Total distance covered = area under v.t. graph
= ar(ΔOAB) + ar(ΔBCD)
= `1/2xx"OB"xx"OA" + 1/2xx"BD"xx"CD"`
= `1/2xx30xx3+1/2xx30xx3`
= 45 + 45
= 90 m
(iv) Ball returns back to thrower in 6s.
⇒ Displacement after 6s = 0
Average velocity = `"Time distance covered"/"Total time taken"=0/6` = 0
Average speed = `"Total distance covered"/"Total time taken"=90/6` = 15 ms−1
APPEARS IN
संबंधित प्रश्न
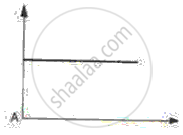
The velocity-time graph for part of a train journey is a horizontal straight line. What does this tell you about the trains velocity.
What can you say about the motion of a body if:
its displacement-time graph is a straight line ?
Multiple choice Question. Select the correct option.
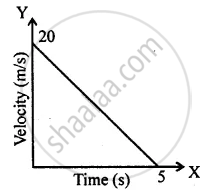
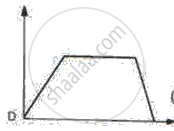
The distance covered in the adjoining velocity-time graph is :
The area of the right triangle under a speed-time graph is 500 m, in a time interval of 20 s. What is the speed of the body? Is the motion uniform or non-uniform?
Given below are the speed -time graphs. Match them with their corresponding motions :
 |
(a) Uniformity retared motion |
 |
(b) Non-uniformity acceleration |
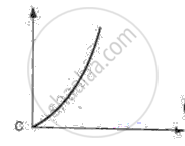 |
(c) Non-uniform motion |
 |
(d) uniform motion |
What can you say about the nature of motion of a body of its displacement-time graph is:
A straight line inclined to the time axis with an acute angle?
Draw velocity-time graph to show:
Zero acceleration
Write a sentence to explain the shape of graph.
Figure shows the distance-time graph of three students A, B and C. On the basis of the graph, answer the following :
When B meets A, where is C?
Saphira moves at a constant speed in the same direction. Rephrase the same sentence in fewer words using concepts related to motion.
A straight line parallel to the x-axis in the velocity-time graph represents the object moving in ______.
