Advertisements
Advertisements
प्रश्न
Figure shows the distance-time graph of three students A, B and C. On the basis of the graph, answer the following :
How far did B travel between the time he passed C and A?
Advertisements
उत्तर

8 travel 4 km between the time he passed C and A.
APPEARS IN
संबंधित प्रश्न
Derive the following equation of motion by the graphical method : v2 = u2 + 2as, where the symbols have their usual meanings.
A body is moving uniformly in a straight line with a velocity of 5 m/s. Find graphically the distance covered by it in 5 seconds.
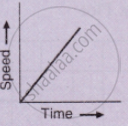
What type of motion is represented by the following graph ?
Multiple choice Question. Select the correct option.
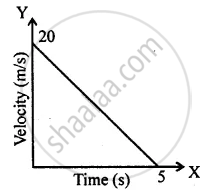
The distance covered in the adjoining velocity-time graph is :
The area of the right triangle under a speed-time graph is 500 m, in a time interval of 20 s. What is the speed of the body? Is the motion uniform or non-uniform?
Draw velocity-time graph to show:
Acceleration
Write a sentence to explain the shape of graph.
Figure shows the velocity-time graphs for two objects A and B moving in same direction . Which object has the greater a cceleration?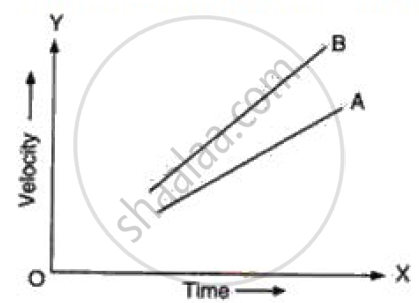
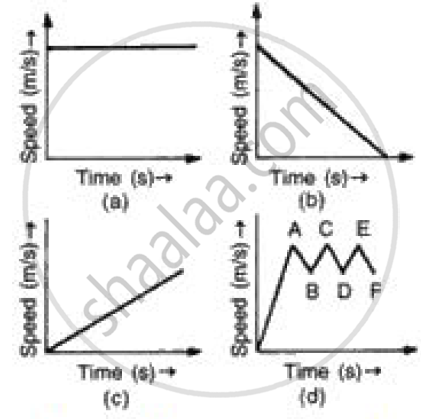
(i) In speed time graph uniform motion is given by a straight line parallel to x axis so figure (a) denotes the uniform motion.
(ii) In speed time graph motion with increasing speed is shown by straight line with positive slope so figure (c) denotes the motion with speed increasing.
(iii) In speed time graph motion with decreasing speed is shown by straight line with negative slope so figure (b) denotes the motion with speed decreasing.
(iv) In speed time graph motion with oscillating speed is shown by zigzag line so figure {d) denotes the motion with speed oscillating.
From the v-t graph, ______ can be calculated.
The velocity-displacement graph describing the motion of a bicycle is shown in the figure.

The acceleration-displacement graph of the bicycle's motion is best described by:
