Advertisements
Advertisements
प्रश्न
The area of the right triangle under a speed-time graph is 500 m, in a time interval of 20 s. What is the speed of the body? Is the motion uniform or non-uniform?
Advertisements
उत्तर
Yes the motion is uniform and the uniform speed is given by area under speed time graph divided by time interval.
So speed = 500/20 =25 m/s.
APPEARS IN
संबंधित प्रश्न
The speed-time graph of an ascending passenger lift is given alongside. What is the acceleration of the lift:
(1) during the first two seconds ?
(2) between second and tenth second ?
(3) during the last two seconds ?
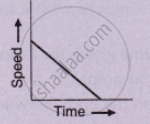
What type of motion is represented by the following graph ?
A ball is thrown up vertically and returns back to thrower in 6 s. Assuming there is no air friction, plot a graph between velocity and time. From the graph calculate
- deceleration
- acceleration
- total distance covered by ball
- average velocity.
Draw the speed-time graph of a body when its initial speed is not zero and the speed increases uniformly with time.
Draw the speed-time graph of a body starting from some point P, gradually picking up speed, then running at a uniform speed and finally slowing down to stop at some point Q.
What can you conclude if the speed-time graph of a body is a curve moving upwards starting from the origin?
Draw the following graph:
Speed versus time for a fluctuating speed.
Its time-displacement graph is a straight line.
Sketch the shape of the velocity-time graph for a body moving with:
Uniformly velocity
The area under velocity – time graph represents the ______
