Advertisements
Advertisements
प्रश्न
The speed-time graph of an ascending passenger lift is given alongside. What is the acceleration of the lift:
(1) during the first two seconds ?
(2) between second and tenth second ?
(3) during the last two seconds ?
Advertisements
उत्तर
(i) We have to find the acceleration from the given graph.
Acceleration = slope of line AB
= `((4.6-0))/((2-0)) "m/s"^2`
= 2.3 `"m/s"^2`
(ii) Between second and tenth second, it represents uniform speed, so, acceleration acting on the lift is zero.
(iii) During the last two seconds, it represents retardation of the lift, so its acceleration is (–2.3 m/s2).
APPEARS IN
संबंधित प्रश्न
Study the speed-time graph of a car given alongside and answer the following questions:
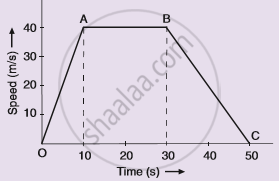
(i) What type of motion is represented by OA ?
(ii) What type of motion is represented by AB ?
(iii) What type of motion is represented by BC ?
(iv) What is the acceleration of car from O to A ?
(v)What is the acceleration of car from A to B ?
(vi) What is the retardation of car from B to C ?
A car of mass 1000 kg is moving with a velocity of 10 m s−1. If the velocity-time graph for this car is a horizontal line parallel to the time axis, then the velocity of car at the end of 25 s will be :
Multiple choice Question. Select the correct option.
A graph is a straight line parallel to the time axis in a distance-time graph. From the graph, it implies:
Multiple choice Question. Select the correct option.
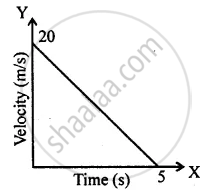
The distance covered in the adjoining velocity-time graph is :
Draw displacement – time graph for the following situation:
When a body is stationary.
Draw the following graph:
Speed versus time for a stepped motion
What does the slope of speed-time graph indicate?
Draw distance-time graph to show:
Decreasing velocity
Draw velocity-time graph to show:
Acceleration
Write a sentence to explain the shape of graph.
If the velocity-time graph has the shape AMB, what would be the shape of the corresponding acceleration-time graph?

