Advertisements
Advertisements
प्रश्न
Multiple choice Question. Select the correct option.
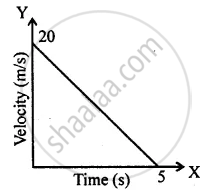
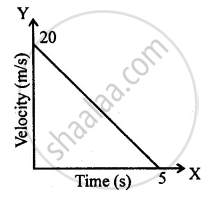
The distance covered in the adjoining velocity-time graph is :
पर्याय
25 m
40 m
50 m
45 m
Advertisements
उत्तर
50 m
Explanation:
Distance covered = Area under velocity – time graph
=1/2 × base × height
a = 1/2 × 5 × 20 = 50 m
APPEARS IN
संबंधित प्रश्न
Name the two quantities, the slope of whose graph give acceleration.
What can you say about the motion of a body if:
its velocity-time graph is a straight line ?
What type of motion is represented by the following graph ?
Multiple choice Question. Select the correct option.
In the velocity-time graph, the acceleration is
Draw velocity – time graph for the following situation:
When a body is moving with variable velocity, but uniform acceleration.
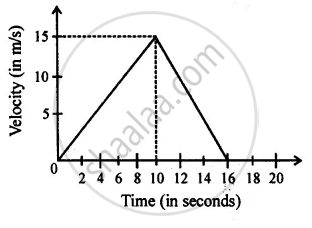
From the diagram given below, calculate distance covered by body.
Represent the location of an object described as at 15 m, 45o west of north, on a graph paper.
Name the physical quantity which is equal to the area under speed-time graph.
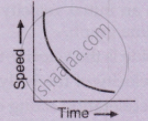
Which of the following graphs represents a motion with negative acceleration?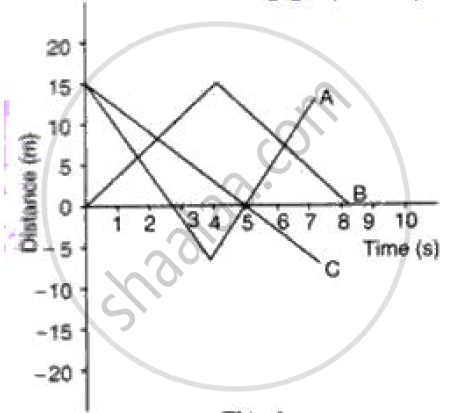
If the velocity-time graph has the shape AMB, what would be the shape of the corresponding acceleration-time graph?

