Advertisements
Advertisements
प्रश्न
Draw a velocity-time graph to show the following motion :
A car accelerates uniformly from rest for 5 s ; then it travels at a steady’ velocity for 5 s.
Advertisements
उत्तर
we have to draw a velocity verses time curve for a moving body . 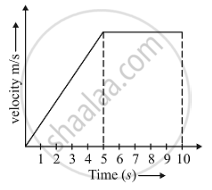
APPEARS IN
संबंधित प्रश्न
Show by means of graphical method that: v = u + at, where the symbols have their usual meanings.
Draw velocity – time graph for the following situation:
When a body is moving with variable velocity, but uniform acceleration.
Represent the position of a body described as at 15 m, 30o north of west, on a graph paper.
Draw the following graph:
Speed versus time for a non-uniform acceleration.
Interpret the following graph: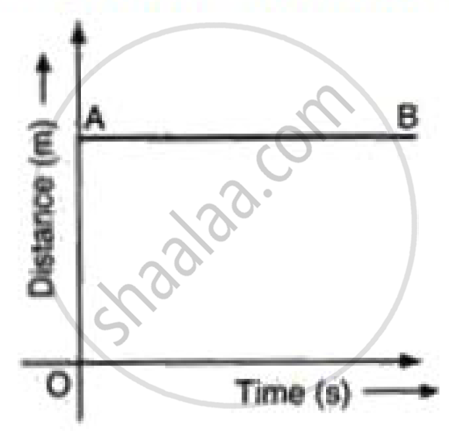
Draw the distance-time graphs of the bodies P and Q starting from rest, moving with uniform speeds with P moving faster than Q.
The area under velocity – time graph represents the ______
A straight line parallel to the x-axis in the velocity-time graph represents the object moving in ______.
The given graph shows the variation of velocity (v) with position (x) for a particle moving along a straight line
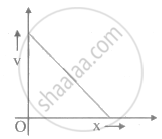
Which of the following graph shows the variation of acceleration (a) with position (x)?
An object is moving in a positive direction with positive acceleration. The velocity-time graph with constant acceleration which represents the above situation is:
