Advertisements
Advertisements
प्रश्न
Draw velocity – time graph for the following situation:
When a body is moving with variable velocity, but uniform acceleration.
Advertisements
उत्तर
Following is the velocity-time graph:
When a body is moving with variable velocity, but uniform acceleration: Then velocity-time graph OA is a straight line inclined to the time axis.

APPEARS IN
संबंधित प्रश्न
What is the quantity which is measured by the area occupied below the velocity-time graph?
What can you say about the motion of a body if:
its displacement-time graph is a straight line ?
Represent the position of a body described as at 15 m, 30o north of west, on a graph paper.
How does the slope of a speed-time graph give the acceleration of a body moving along a straight line?
Draw the speed-time graph of a body when its initial speed is not zero and the speed increases uniformly with time.
Figure shows displacement- time graph of two objects A and B moving in a stra ight line. Which object is moving fa ster?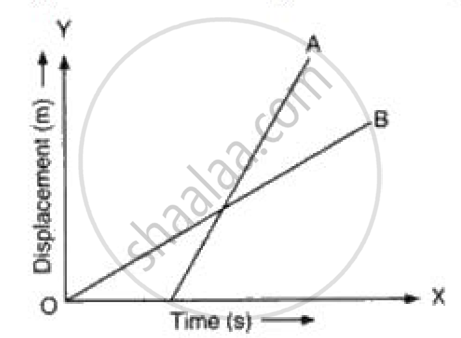
What can you say about the nature of motion of a body of its displacement-time graph is:
A straight line inclined to the time axis with an acute angle?
Draw distance-time graph to show:
Increasing velocity
Sketch the shape of the velocity-time graph for a body moving with:
Uniformly velocity
If the velocity-time graph has the shape AMB, what would be the shape of the corresponding acceleration-time graph?

