Advertisements
Advertisements
प्रश्न
Draw velocity – time graph for the following situation:
When a body is moving with variable velocity, but uniform retardation.
Advertisements
उत्तर
Following is the velocity-time graph:
When a body is moving with variable velocity, but uniform retardation

APPEARS IN
संबंधित प्रश्न
A body is moving vertically upwards. Its velocity changes at a constant rate from 50 m s−1 to 20 m s−1 in 3 s. What is its acceleration?
A vehicle is accelerating on a straight road. Its velocity at any instant is 30 km/h. After 2 s, it is 33.6 km/h, and after further 2 s, it is 37.2 km/h. Find the acceleration of the vehicle in m s-2. Is the acceleration uniform?
What does a positive acceleration mean?
Write the SI unit of retardation.
The initial velocity of a car is 10 ms-1. It moves with an acceleration of 2 ms-2. What will be its speed after 10 seconds?
A car is moving with a speed of 50 km/h. One second later, its speed is 55 km/h. What is its acceleration?
Figure represents graphically the velocity of a car moving along a straight road over a period of 100 hours.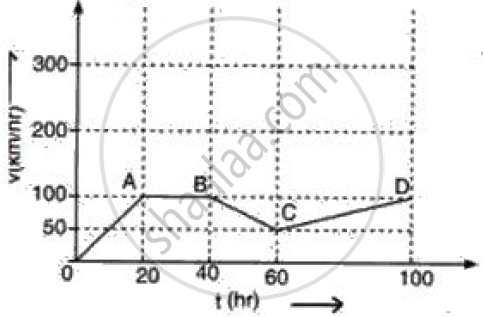
Calculate the acceleration along AB and the retardation along BC.
The Unit of acceleration is ______.
Assertion: Position-time graph of a stationary object is a straight line parallel to the time axis.
Reason: For a stationary object, the position does not change with time.
