Advertisements
Advertisements
प्रश्न
Sketch the shape of the velocity-time graph for a body moving with:
Uniformly velocity
Advertisements
उत्तर

APPEARS IN
संबंधित प्रश्न
What can you say about the motion of a body if its speed-time graph is a straight line parallel to the time axis ?
Derive the following equation of motion by the graphical method : v2 = u2 + 2as, where the symbols have their usual meanings.
Draw velocity – time graph for the following situation:
When a body, is moving with uniform velocity.
Diagram shows a velocity – time graph for a car starting from rest. The graph has three sections AB, BC, and CD.

In which section, car has a zero acceleration?
Draw the following graph:
Speed versus time for a fluctuating speed.
Draw the following graph:
Speed versus time for a uniformly retarded motion.
Interpret the following graph: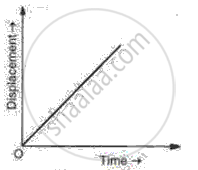
Draw velocity-time graph to show:
Zero acceleration
Write a sentence to explain the shape of graph.
State whether true or false. If false, correct the statement.
If the velocity – time graph of a particle is a straight line inclined to X-axis then its displacement – time graph will be a straight line.
The given graph shows the variation of velocity (v) with position (x) for a particle moving along a straight line
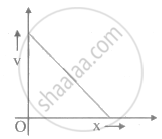
Which of the following graph shows the variation of acceleration (a) with position (x)?
