Advertisements
Advertisements
प्रश्न
Draw the following graph:
Speed versus time for a uniformly retarded motion.
Advertisements
उत्तर

Spped time graph for a uniformity retarded motion
APPEARS IN
संबंधित प्रश्न
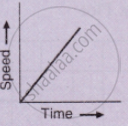
What type of motion is represented by the following graph ?
What does the slope of a displacement-time graph represent?
A ball is thrown up vertically and returns back to thrower in 6 s. Assuming there is no air friction, plot a graph between velocity and time. From the graph calculate
- deceleration
- acceleration
- total distance covered by ball
- average velocity.
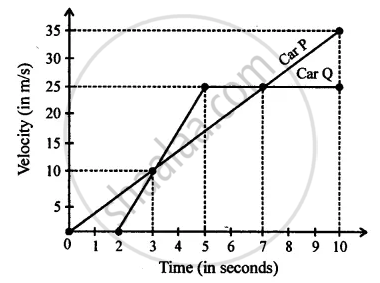
Diagram is given below shows velocity – time graph of car P and Q, starting from the same place and in the same direction. Calculate which car is ahead after 10 s and by how much?
What can you conclude if the speed-time graph of a body is a curve moving upwards starting from the origin?
Draw the following graph:
Distance versus time for a body at rest.
What can you say about the motion of a body if:
Its time-velocity graph is a straight line
Draw distance-time graph to show:
Uniform velocity
Draw velocity-time graph to show:
Zero acceleration
Write a sentence to explain the shape of graph.
What does the slope of velocity-time graph represent?
