Advertisements
Advertisements
प्रश्न
Interpret the following graph:
Advertisements
उत्तर

If distance time graph of a body is straight line parallel to x axis then the body is said to be at rest .
APPEARS IN
संबंधित प्रश्न
What is the quantity which is measured by the area occupied below the velocity-time graph?
A body with an initial velocity x moves with a uniform acceleration y. Plot its velocity-time graph.
Multiple choice Question. Select the correct option.
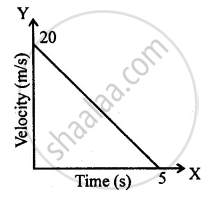
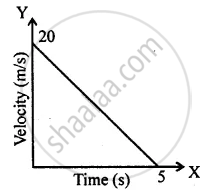
In the velocity-time graph, the acceleration is
Multiple choice Question. Select the correct option.
The distance covered in the adjoining velocity-time graph is :
What can you conclude if the speed-time graph of a body is a straight line sloping upwards and not passing through the origin?
Which of the following graphs represents a motion with negative acceleration?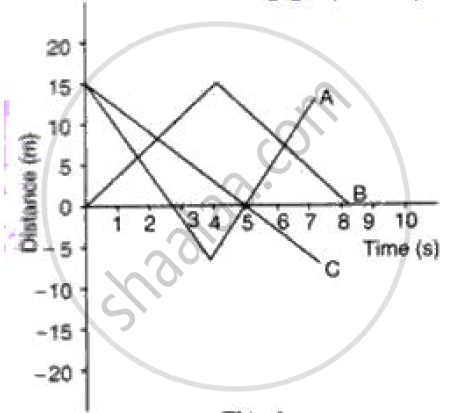
What can you say about the nature of motion of a body of its displacement-time graph is:
A straight line inclined to the time axis with an acute angle?
Draw velocity-time graph to show:
Acceleration
Write a sentence to explain the shape of graph.
The slope of the speed–time graph gives ______.
The area under the v-t graph represents a physical quantity that has the unit.
