Advertisements
Advertisements
प्रश्न
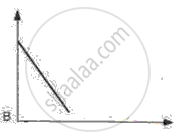
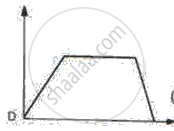
Draw velocity-time graph to show:
Deceleration
Write a sentence to explain the shape of graph.
Advertisements
उत्तर

Deceleration is represented by a straight line having a negative slope with time axis.
APPEARS IN
संबंधित प्रश्न
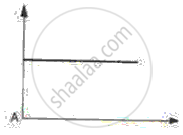
Draw a velocity-time graph to show the following motion :
A car accelerates uniformly from rest for 5 s ; then it travels at a steady’ velocity for 5 s.
Draw a displacement-time graph for a boy going to school with uniform velocity.
What does the area of an acceleration – time graph represent?
From the velocity – time graph given below, calculate acceleration in the region AB.

Given on th e side are a few speed - time graphs for various objects moving along a stra ight line. Refer below figure. (a), (b), (c) and (d).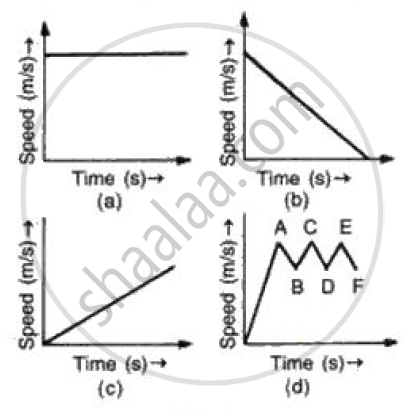
Which of these graphs represent
(a) Uni form motion
(b) Motion with speed increasing
(c) Motion with speed decreasing and
(d) Motion with speed oscillating.?
Given below are the speed -time graphs. Match them with their corresponding motions :
 |
(a) Uniformity retared motion |
 |
(b) Non-uniformity acceleration |
 |
(c) Non-uniform motion |
 |
(d) uniform motion |
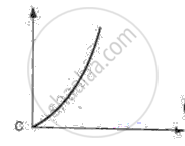
Draw distance-time graph to show:
Increasing velocity
What does the slope of velocity-time graph represent?
Mention the uses of the velocity-time graph.
The area under the v-t graph represents a physical quantity that has the unit.
