Advertisements
Advertisements
प्रश्न
From the velocity – time graph given below, calculate acceleration in the region AB.

Advertisements
उत्तर
Acceleration in the region AB = Slope of v.t. graph from A to B
= `"BF"/"AF"=14/12` = 1.16 ms−2
APPEARS IN
संबंधित प्रश्न
What is the quantity which is measured by the area occupied below the velocity-time graph?
Draw a velocity-time graph to show the following motion :
A car accelerates uniformly from rest for 5 s ; then it travels at a steady’ velocity for 5 s.
Name the physical quantity which is equal to the area under speed-time graph.
Draw the following graph:
Speed versus time for a stepped motion
Interpret the following graph: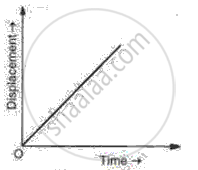
Sketch the shape of the velocity-time graph for a body moving with:
Uniformly velocity
Derive the equation
S = ut+ `1/2` at2
Using a speed- time graph
The slope of the speed–time graph gives ______.
State whether true or false. If false, correct the statement.
If the velocity – time graph of a particle is a straight line inclined to X-axis then its displacement – time graph will be a straight line.
The velocity-displacement graph describing the motion of a bicycle is shown in the figure.

The acceleration-displacement graph of the bicycle's motion is best described by:
