Advertisements
Advertisements
प्रश्न
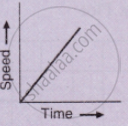
From the velocity – time graph given below, calculate acceleration in the region AB.

Advertisements
उत्तर
Acceleration in the region AB = Slope of v.t. graph from A to B
= `"BF"/"AF"=14/12` = 1.16 ms−2
APPEARS IN
संबंधित प्रश्न
What does the slope of a speed-time graph indicate ?
What type of motion is represented by the following graph ?
Draw velocity – time graph for the following situation:
When a body, is moving with uniform velocity.
How will you use a speed-time graph to find whether the acceleration of the body is uniform or not?
What does the slope of speed-time graph indicate?
Which of the following graphs represents a motion with negative acceleration?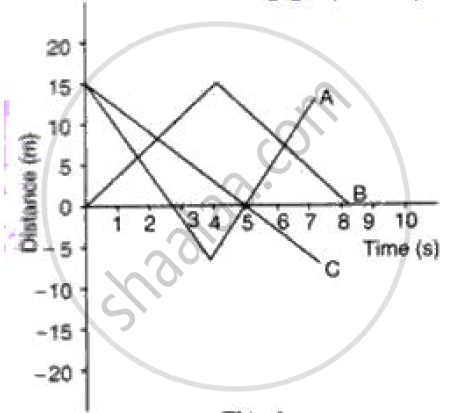
Draw distance-time graph to show:
Uniform velocity
Draw velocity-time graph to show:
Acceleration
Write a sentence to explain the shape of graph.
Draw velocity-time graph to show:
Deceleration
Write a sentence to explain the shape of graph.
The given graph shows the variation of velocity (v) with position (x) for a particle moving along a straight line
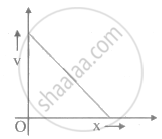
Which of the following graph shows the variation of acceleration (a) with position (x)?
