Advertisements
Advertisements
प्रश्न
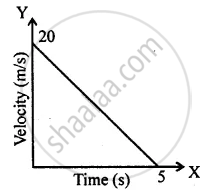
Which of the following graphs represents a motion with negative acceleration?
Advertisements
उत्तर
Graph (c) represents a motion with negative acceleration.
APPEARS IN
संबंधित प्रश्न
What can you say about the motion of a body if:
its velocity-time graph is a straight line ?
Multiple choice Question. Select the correct option.
The distance covered in the adjoining velocity-time graph is :
A ball is thrown up vertically and returns back to thrower in 6 s. Assuming there is no air friction, plot a graph between velocity and time. From the graph calculate
- deceleration
- acceleration
- total distance covered by ball
- average velocity.
The area under a speed-time graph in a given intervals gives the total distance covered by a body irrespective of its motion being uniform or non-uniform.
How does the slope of a speed-time graph give the acceleration of a body moving along a straight line?
Its time-displacement graph is a straight line.
Draw distance-time graph to show:
Increasing velocity
What does the slope of velocity-time graph represent?
Figure shows the velocity-time graphs for two objects A and B moving in same direction . Which object has the greater a cceleration?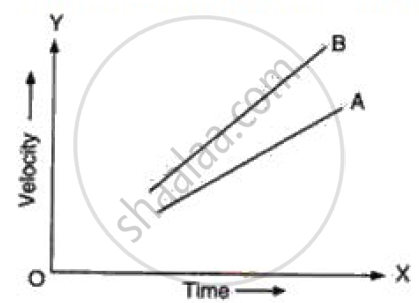
Sketch the shape of the velocity-time graph for a body moving with:
Uniformly velocity
