Advertisements
Advertisements
प्रश्न
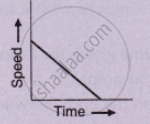
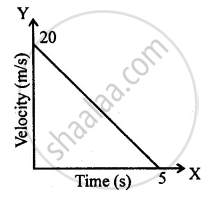
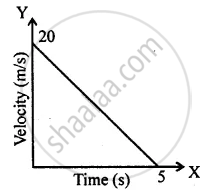
Which of the following graphs represents a motion with negative acceleration?
Advertisements
उत्तर
Graph (c) represents a motion with negative acceleration.
APPEARS IN
संबंधित प्रश्न
What type of motion is represented by the following graph ?
Multiple choice Question. Select the correct option.
In the velocity-time graph, the acceleration is
Multiple choice Question. Select the correct option.
The distance covered in the adjoining velocity-time graph is :
From the velocity – time graph given below, calculate Distance covered in the region ABCE.

Draw the speed-time graph of a body when its initial speed is not zero and the speed increases uniformly with time.
What can you conclude if the speed-time graph of a body is a straight line sloping upwards and not passing through the origin?
Interpret the following graph:
What does the slope of speed-time graph indicate?
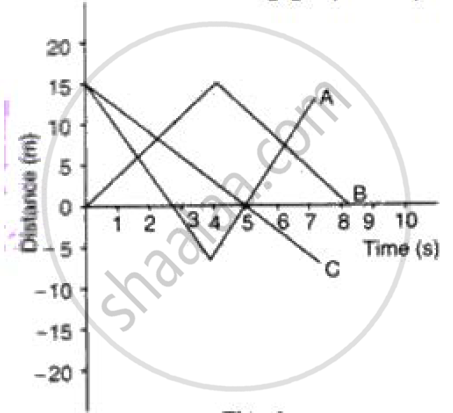
Figure shows the distance-time graph of three students A, B and C. On the basis of the graph, answer the following :
Will the three ever meet at any point on the road?
Figure shows the distance-time graph of three students A, B and C. On the basis of the graph, answer the following :
How far did B travel between the time he passed C and A?
