Advertisements
Advertisements
प्रश्न
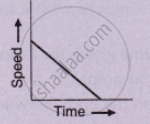
What type of motion is represented by the following graph ?
Advertisements
उत्तर
Graph (c) represents uniformly retarding motion as it has a constant negative slope.
APPEARS IN
संबंधित प्रश्न
Show by means of graphical method that: v = u + at, where the symbols have their usual meanings.
Diagram shows a velocity – time graph for a car starting from rest. The graph has three sections AB, BC and CD.

Compare the distance travelled in section BC with the distance travelled in section AB.
From the velocity – time graph given below, calculate Average velocity in region CED.

Represent the position of a body described as at 15 m, 30o north of west, on a graph paper.
Draw the following graph:
Speed versus time for a non-uniform acceleration.
Figure shows displacement- time graph of two objects A and B moving in a stra ight line. Which object is moving fa ster?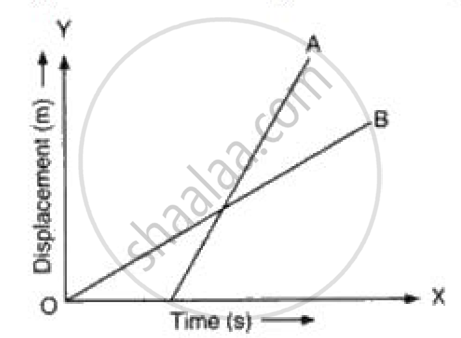
What can you say about the nature of motion of a body of its displacement-time graph is:
A straight line parallel to line axis?
Draw velocity-time graph to show:
Acceleration
Write a sentence to explain the shape of graph.
Sketch the shape of the velocity-time graph for a body moving with:
Uniformly velocity
Mention the uses of the velocity-time graph.
