Advertisements
Advertisements
प्रश्न
Diagram shows a velocity – time graph for a car starting from rest. The graph has three sections AB, BC and CD.

Compare the distance travelled in section BC with the distance travelled in section AB.
Advertisements
उत्तर
`"Distance travelled in part BC"/"Distance travelled in part AB"=("v"_0xx"t")/(1/2xx"t"xx"v"_0)=2/1=2:1`
APPEARS IN
संबंधित प्रश्न
The velocity-time graph for part of a train journey is a horizontal straight line. What does this tell you about the trains velocity.
The velocity-time graph for part of a train journey is a horizontal straight line. What does this tell you about its acceleration ?
Diagram is given below shows velocity – time graph of car P and Q, starting from the same place and in the same direction. Calculate at what time intervals both cars have the same velocity?

Represent the position of a body described as at 15 m, 30o north of west, on a graph paper.
Name the physical quantity which is equal to the area under speed-time graph.
Interpret the following graph: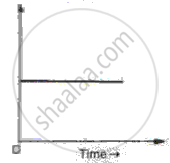
What can you say about the nature of motion of a body of its displacement-time graph is:
A straight line parallel to line axis?
What does the slope of velocity-time graph represent?
Figure shows the distance-time graph of three students A, B and C. On the basis of the graph, answer the following :
Which of the three is traveling the fastest?
Figure shows the distance-time graph of three students A, B and C. On the basis of the graph, answer the following :
Will the three ever meet at any point on the road?
