Advertisements
Advertisements
प्रश्न
Represent the position of a body described as at 15 m, 30o north of west, on a graph paper.
Advertisements
उत्तर

APPEARS IN
संबंधित प्रश्न
Draw a velocity-time graph to show the following motion :
A car accelerates uniformly from rest for 5 s ; then it travels at a steady’ velocity for 5 s.
What does the slope of a displacement-time graph represent?
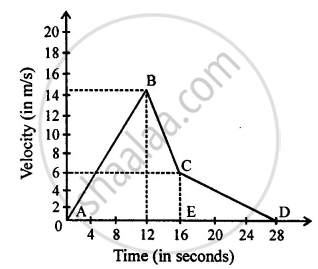
From the velocity – time graph given below, calculate Average velocity in region CED.
Draw the following graph:
Speed versus time for a stepped motion
Draw velocity-time graph to show:
Deceleration
Write a sentence to explain the shape of graph.
Derive the equation
S = ut+ `1/2` at2
Using a speed- time graph
Draw the distance-time graphs of the bodies P and Q starting from rest, moving with uniform speeds with P moving faster than Q.
Figure shows the distance-time graph of three students A, B and C. On the basis of the graph, answer the following :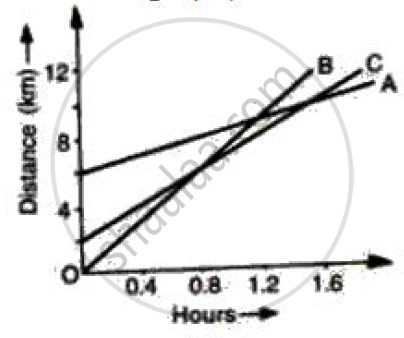
When B meets A, where is C?
The slope of the speed–time graph gives ______.
The area under velocity – time graph represents the ______
