Advertisements
Advertisements
प्रश्न
Represent the position of a body described as at 15 m, 30o north of west, on a graph paper.
Advertisements
उत्तर

APPEARS IN
संबंधित प्रश्न
What can you say about the motion of a body if:
its displacement-time graph is a straight line ?
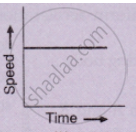
What type of motion is represented by the following graph ?
What does the slope of a displacement-time graph represent?
A ball is thrown up vertically and returns back to thrower in 6 s. Assuming there is no air friction, plot a graph between velocity and time. From the graph calculate
- deceleration
- acceleration
- total distance covered by ball
- average velocity.
How does the slope of a speed-time graph give the acceleration of a body moving along a straight line?
The graph of one quantity versus another result in a straight line. How are the quantities related to each other?
What can you conclude if the speed-time graph of a body is a curve moving upwards starting from the origin?
Its time-displacement graph is a straight line.
State whether true or false. If false, correct the statement.
If the velocity – time graph of a particle is a straight line inclined to X-axis then its displacement – time graph will be a straight line.
The given graph shows the variation of velocity (v) with position (x) for a particle moving along a straight line
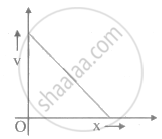
Which of the following graph shows the variation of acceleration (a) with position (x)?
