Advertisements
Advertisements
Question
Represent the position of a body described as at 15 m, 30o north of west, on a graph paper.
Advertisements
Solution

APPEARS IN
RELATED QUESTIONS
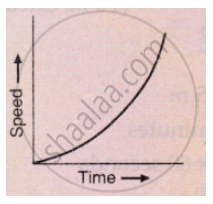
What conclusion can you draw about the acceleration of a body from the speed-time graph shown below .
Show by using the graphical method that: `s=ut+1/2at^2` where the symbols have their usual meanings.
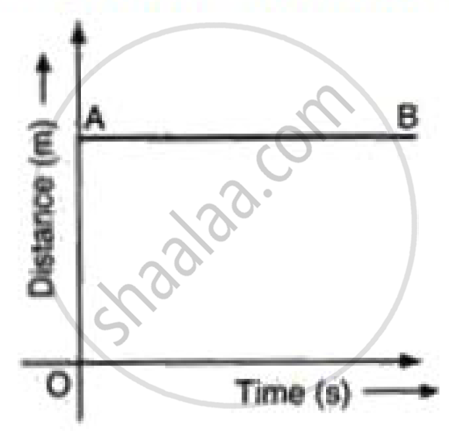
What type of motion is represented by the following graph ?
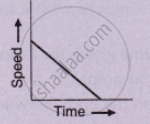
Draw velocity – time graph for the following situation:
When a body is moving with variable velocity, but uniform acceleration.
A body at rest is thrown downward from the top of the tower. Draw a distance – time graph of its free fall under gravity during the first 3 seconds. Show your table of values starting t = 0 with an interval of 1 second, (g = 10 ms−2).
How will you use a speed-time graph to find whether the acceleration of the body is uniform or not?
Figure shows displacement- time graph of two objects A and B moving in a stra ight line. Which object is moving fa ster?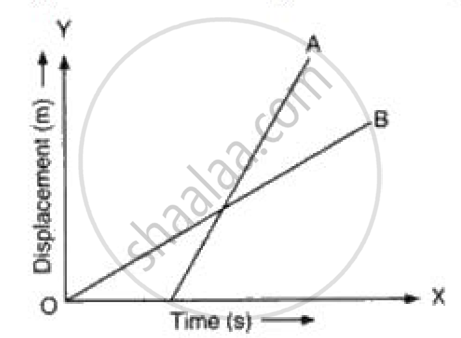
What can you say about the nature of motion of a body of its displacement-time graph is:
A straight line inclined to the time axis with an acute angle?
What can you say about the motion of a body if:
Its time-velocity graph is a straight line
Interpret the following graph: