Advertisements
Advertisements
Question
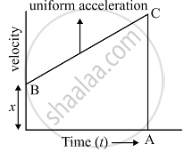
A body with an initial velocity x moves with a uniform acceleration y. Plot its velocity-time graph.
Advertisements
Solution
We have to plot a graph between velocity and time. From the graph we can conclude that the curve is a straight line showing uniform acceleration.
APPEARS IN
RELATED QUESTIONS
Name the two quantities, the slope of whose graph give acceleration.
Derive the following equation of motion by the graphical method : v2 = u2 + 2as, where the symbols have their usual meanings.
Study the speed-time graph of a car given alongside and answer the following questions:
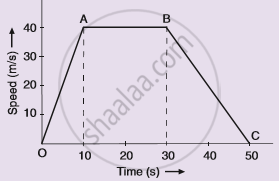
(i) What type of motion is represented by OA ?
(ii) What type of motion is represented by AB ?
(iii) What type of motion is represented by BC ?
(iv) What is the acceleration of car from O to A ?
(v)What is the acceleration of car from A to B ?
(vi) What is the retardation of car from B to C ?
Represent the location of an object described as at 15 m, 45o west of north, on a graph paper.
Draw the following graph:
Speed versus time for a fluctuating speed.
Interpret the following graph: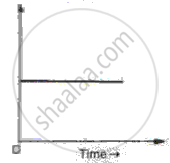
Figure shows displacement- time graph of two objects A and B moving in a stra ight line. Which object is moving fa ster?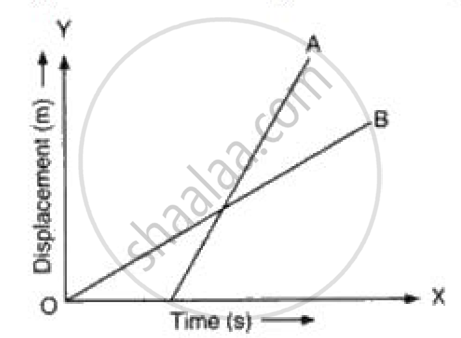
Draw velocity-time graph to show:
Zero acceleration
Write a sentence to explain the shape of graph.
What does the slope of velocity-time graph represent?
Mention the uses of the velocity-time graph.
