Advertisements
Advertisements
Question
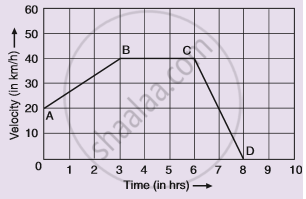
Given alongside is the velocity-time graph for a moving body :
Find :
(i) Velocity of the body at point C.
(ii) Acceleration acting on the body between A and B.
(iii) Acceleration acting on the body between B and C.
Advertisements
Solution
(i) BC represents uniform velocity. So velocity of the body at point C is 40 km
(ii) Acceleration = Slope of line AB
= `((40-20))/((3-0)) (km)/(hr^2)`
= 6.66 `"km/hr"^2`
(iii) BC represents uniform velocity, so, acceleration acting on the body is zero.
APPEARS IN
RELATED QUESTIONS
What does the slope of a speed-time graph indicate ?
Name the two quantities, the slope of whose graph give acceleration.
Diagram shows a velocity – time graph for a car starting from rest. The graph has three sections AB, BC, and CD.

In which section, car has a zero acceleration?
Diagram is given below shows velocity – time graph of car P and Q, starting from the same place and in the same direction. Calculate at what time intervals both cars have the same velocity?

How does the slope of a speed-time graph give the acceleration of a body moving along a straight line?
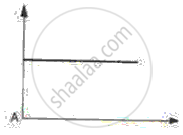
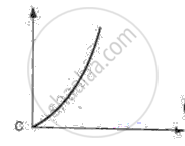
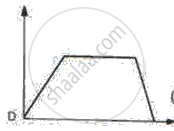
Given below are the speed -time graphs. Match them with their corresponding motions :
 |
(a) Uniformity retared motion |
 |
(b) Non-uniformity acceleration |
 |
(c) Non-uniform motion |
 |
(d) uniform motion |
Derive the equation
S = ut+ `1/2` at2
Using a speed- time graph
Draw the distance-time graphs of the bodies P and Q starting from rest, moving with uniform speeds with P moving faster than Q.
The area of the velocity-time graph gives the displacement of the body.
The velocity-displacement graph describing the motion of a bicycle is shown in the figure.

The acceleration-displacement graph of the bicycle's motion is best described by:
