Advertisements
Advertisements
Question
Figure shows the distance-time graph of three students A, B and C. On the basis of the graph, answer the following :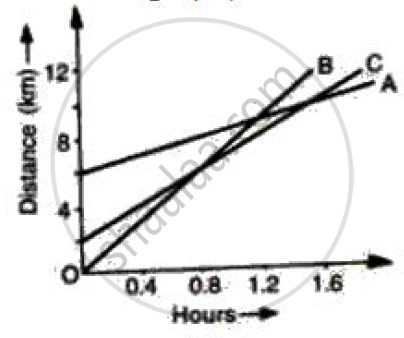
When B meets A, where is C?
Advertisements
Solution
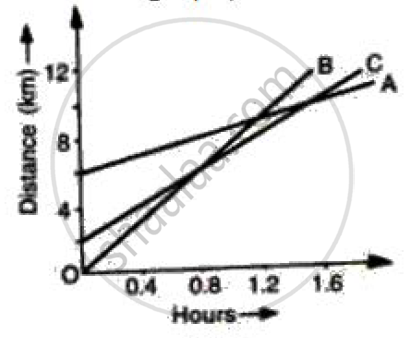
C is at 8 km when B meets A.
APPEARS IN
RELATED QUESTIONS
Show by using the graphical method that: `s=ut+1/2at^2` where the symbols have their usual meanings.
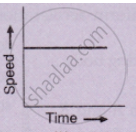
What type of motion is represented by the following graph ?
Define speed. What is its S.I. unit?
Diagram shows a velocity – time graph for a car starting from rest. The graph has three sections AB, BC, and CD.
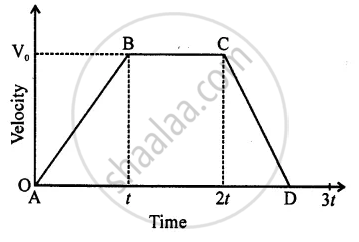
In which section, car has a zero acceleration?
From the velocity – time graph given below, calculate Distance covered in the region ABCE.
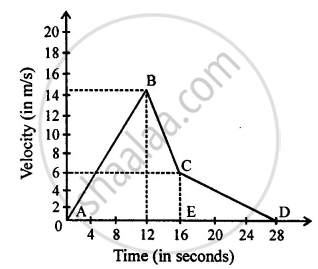
Name the physical quantity which is equal to the area under speed-time graph.
The graph of one quantity versus another result in a straight line. How are the quantities related to each other?
Given on th e side are a few speed - time graphs for various objects moving along a stra ight line. Refer below figure. (a), (b), (c) and (d).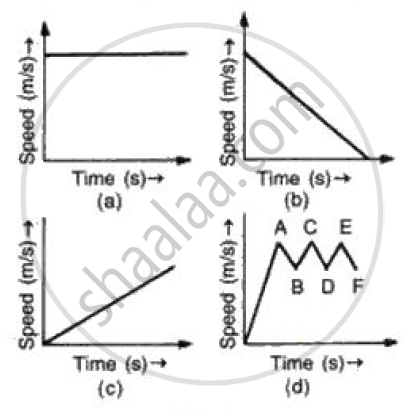
Which of these graphs represent
(a) Uni form motion
(b) Motion with speed increasing
(c) Motion with speed decreasing and
(d) Motion with speed oscillating.?
Draw distance-time graph to show:
Uniform velocity
Mention the uses of the velocity-time graph.
