Advertisements
Advertisements
Question
Figure shows the distance-time graph of three students A, B and C. On the basis of the graph, answer the following :
How far did B travel between the time he passed C and A?
Advertisements
Solution

8 travel 4 km between the time he passed C and A.
APPEARS IN
RELATED QUESTIONS
Show by means of graphical method that: v = u + at, where the symbols have their usual meanings.
What can you say about the motion of a body if:
its displacement-time graph is a straight line ?
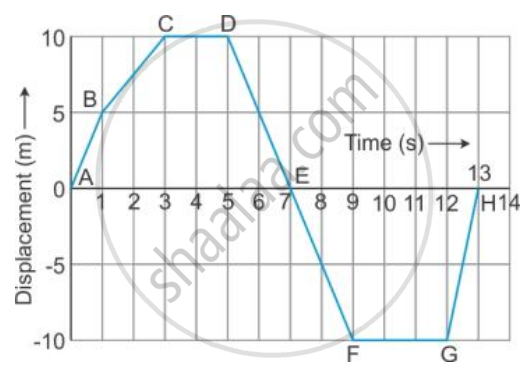
From the displacement-time graph of a cyclist given below in the Figure, find The time after which he reaches the starting point .
Multiple choice Question. Select the correct option.
The slope of displacement – time graph represents.
Multiple choice Question. Select the correct option.
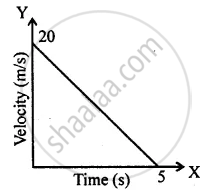
The distance covered in the adjoining velocity-time graph is :
The graph of one quantity versus another result in a straight line. How are the quantities related to each other?
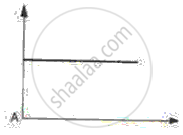
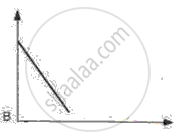
Given below are the speed -time graphs. Match them with their corresponding motions :
 |
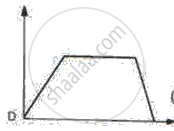
(a) Uniformity retared motion |
 |
(b) Non-uniformity acceleration |
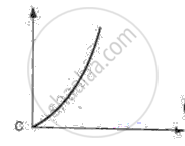 |
(c) Non-uniform motion |
 |
(d) uniform motion |
Draw velocity-time graph to show:
Acceleration
Write a sentence to explain the shape of graph.
Figure shows the distance-time graph of three students A, B and C. On the basis of the graph, answer the following :
Which of the three is traveling the fastest?
State whether true or false. If false, correct the statement.
If the velocity – time graph of a particle is a straight line inclined to X-axis then its displacement – time graph will be a straight line.
