Advertisements
Advertisements
प्रश्न
Figure shows the distance-time graph of three students A, B and C. On the basis of the graph, answer the following :
How far did B travel between the time he passed C and A?
Advertisements
उत्तर

8 travel 4 km between the time he passed C and A.
APPEARS IN
संबंधित प्रश्न
What is the quantity which is measured by the area occupied below the velocity-time graph?
A body at rest is thrown downward from the top of the tower. Draw a distance – time graph of its free fall under gravity during the first 3 seconds. Show your table of values starting t = 0 with an interval of 1 second, (g = 10 ms−2).
The graph of one quantity versus another result in a straight line. How are the quantities related to each other?
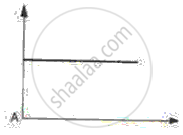
Draw the speed-time graph of a body when its initial speed is not zero and the speed increases uniformly with time.
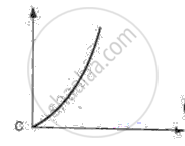
What can you conclude if the speed-time graph of a body is a curve moving upwards starting from the origin?
Draw the following graph:
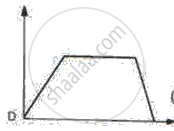
Speed versus time for a stepped motion
Draw the following graph:
Speed versus time for a non-uniform acceleration.
Given below are the speed -time graphs. Match them with their corresponding motions :
 |
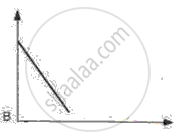
(a) Uniformity retared motion |
 |
(b) Non-uniformity acceleration |
 |
(c) Non-uniform motion |
 |
(d) uniform motion |
Draw velocity-time graph to show:
Deceleration
Write a sentence to explain the shape of graph.
The area of the velocity-time graph gives the displacement of the body.
