Advertisements
Advertisements
प्रश्न
Figure shows the distance-time graph of three students A, B and C. On the basis of the graph, answer the following :
When B meets A, where is C?
Advertisements
उत्तर

C is at 8 km when B meets A.
APPEARS IN
संबंधित प्रश्न
What can you say about the motion of a body if its speed-time graph is a straight line parallel to the time axis ?
Draw a velocity-time graph to show the following motion :
A car accelerates uniformly from rest for 5 s ; then it travels at a steady’ velocity for 5 s.
A body is moving uniformly in a straight line with a velocity of 5 m/s. Find graphically the distance covered by it in 5 seconds.
Three speed-time graphs are given below :
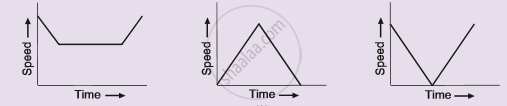
Which graph represents the case of:
(i) a cricket ball thrown vertically upwards and returning to the hands of the thrower ?
(ii) a trolley decelerating to a constant speed and then accelerating uniformly ?
From the velocity – time graph given below, calculate Average velocity in region CED.

Diagram is given below shows velocity – time graph of car P and Q, starting from the same place and in the same direction. Calculate which car is ahead after 10 s and by how much?

Its time-displacement graph is a straight line.
Draw distance-time graph to show:
Uniform velocity
Saphira moves at a constant speed in the same direction. Rephrase the same sentence in fewer words using concepts related to motion.
From the v-t graph, ______ can be calculated.
