Advertisements
Advertisements
प्रश्न
Three speed-time graphs are given below :
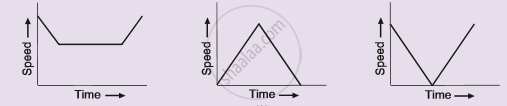
Which graph represents the case of:
(i) a cricket ball thrown vertically upwards and returning to the hands of the thrower ?
(ii) a trolley decelerating to a constant speed and then accelerating uniformly ?
Advertisements
उत्तर
(i) Graph (c) represents a cricket ball thrown vertically upwards and returning to the hands of the thrower.
(ii) Graph (a) represents a trolley decelerating to a constant speed and then accelerating uniformly.
APPEARS IN
संबंधित प्रश्न
Fill in the following blank with suitable word :
In a speed-time graph, the area enclosed by the speed-time curve and the time axis gives the…………….. by the body.
The speed-time graph of an ascending passenger lift is given alongside. What is the acceleration of the lift:
(1) during the first two seconds ?
(2) between second and tenth second ?
(3) during the last two seconds ?
A car of mass 1000 kg is moving with a velocity of 10 m s−1. If the velocity-time graph for this car is a horizontal line parallel to the time axis, then the velocity of car at the end of 25 s will be :
Multiple choice Question. Select the correct option.
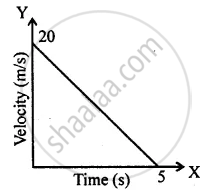
The distance covered in the adjoining velocity-time graph is :
The area under a speed-time graph in a given intervals gives the total distance covered by a body irrespective of its motion being uniform or non-uniform.
Draw the following graph:
Speed versus time for a non-uniform acceleration.
Draw the following graph:
Speed versus time for a fluctuating speed.
Draw the distance-time graphs of the bodies P and Q starting from rest, moving with uniform speeds with P moving faster than Q.
State whether true or false. If false, correct the statement.
If the velocity – time graph of a particle is a straight line inclined to X-axis then its displacement – time graph will be a straight line.
A straight line parallel to the x-axis in the velocity-time graph represents the object moving in ______.
