Advertisements
Advertisements
प्रश्न
Study the speed-time graph of a car given alongside and answer the following questions:
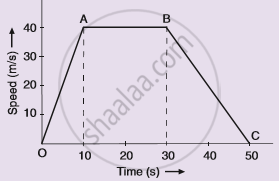
(i) What type of motion is represented by OA ?
(ii) What type of motion is represented by AB ?
(iii) What type of motion is represented by BC ?
(iv) What is the acceleration of car from O to A ?
(v)What is the acceleration of car from A to B ?
(vi) What is the retardation of car from B to C ?
Advertisements
उत्तर
(i) OA represents uniform acceleration
(ii) AB represents constant speed.
(iii) BC represents uniform retardation.
(iv) Acceleration of car from O to A = slope of line OA
`a = ((40-0))/((10-0))
= 4 "m/s"^2`
(v) Acceleration of car from A to B is zero as it has uniform speed .
(vi) Retardation of car from B to C = slope of line BC
`a = ((40-0))/((50-30)) "m/s"^2`
= `2 "m/s"^2`
APPEARS IN
संबंधित प्रश्न
Derive the following equation of motion by the graphical method : v2 = u2 + 2as, where the symbols have their usual meanings.
Draw a velocity-time graph for the free fall of a body under gravity starting from rest. Take g = 10m s-2
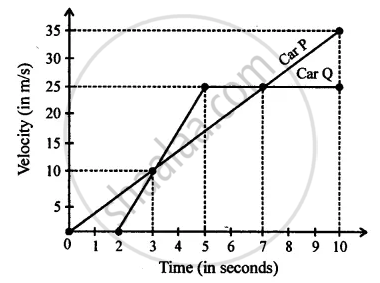
Diagram is given below shows velocity – time graph of car P and Q, starting from the same place and in the same direction. Calculate which car is ahead after 10 s and by how much?
Draw the following graph:
Speed versus time for a non-uniform acceleration.
What does the slope of speed-time graph indicate?
Which of the following graphs represents a motion with negative acceleration?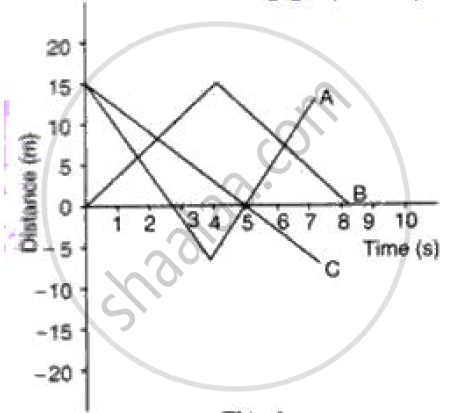
Draw velocity-time graph to show:
Deceleration
Write a sentence to explain the shape of graph.
What does the slope of velocity-time graph represent?
Sketch the shape of the velocity-time graph for a body moving with:
Uniformly velocity
From the v-t graph, ______ can be calculated.
