Advertisements
Advertisements
प्रश्न
What does the slope of speed-time graph indicate?
Advertisements
उत्तर
Slope of speed time graph represents acceleration.
APPEARS IN
संबंधित प्रश्न
What does the slope of a speed-time graph indicate ?
Show by using the graphical method that: `s=ut+1/2at^2` where the symbols have their usual meanings.
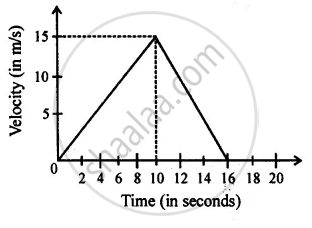
From the diagram given below, calculate distance covered by body.
The area of the right triangle under a speed-time graph is 500 m, in a time interval of 20 s. What is the speed of the body? Is the motion uniform or non-uniform?
The graph of one quantity versus another result in a straight line. How are the quantities related to each other?
Draw the following graph:
Distance versus time for a body at rest.
Draw the following graph:
Speed versus time for a fluctuating speed.
Interpret the following graph:
Which of the following graphs represents a motion with negative acceleration?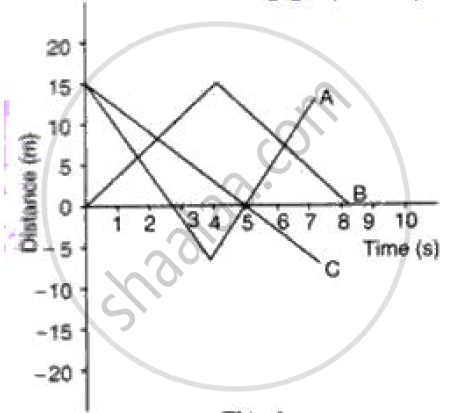
What can you say about the nature of motion of a body of its displacement-time graph is:
A straight line inclined to the time axis with an acute angle?
