Advertisements
Advertisements
प्रश्न
What does the slope of speed-time graph indicate?
Advertisements
उत्तर
Slope of speed time graph represents acceleration.
APPEARS IN
संबंधित प्रश्न
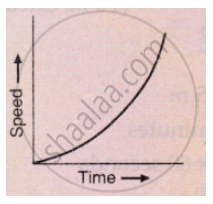
What conclusion can you draw about the acceleration of a body from the speed-time graph shown below .
The velocity-time graph for part of a train journey is a horizontal straight line. What does this tell you about its acceleration ?
A body is moving uniformly in a straight line with a velocity of 5 m/s. Find graphically the distance covered by it in 5 seconds.
Three speed-time graphs are given below :
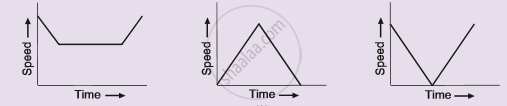
Which graph represents the case of:
(i) a cricket ball thrown vertically upwards and returning to the hands of the thrower ?
(ii) a trolley decelerating to a constant speed and then accelerating uniformly ?
What does the slope of a displacement-time graph represent?
Diagram shows a velocity – time graph for a car starting from rest. The graph has three sections AB, BC and CD.
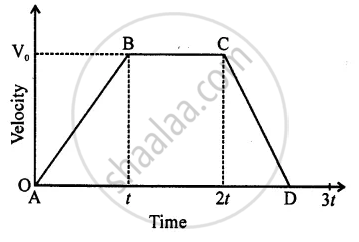
Compare the distance travelled in section BC with the distance travelled in section AB.
Draw the following graph:
Speed versus time for a non-uniform acceleration.
What can you say about the nature of motion of a body of its displacement-time graph is:
A straight line parallel to line axis?
Interpret the following graph: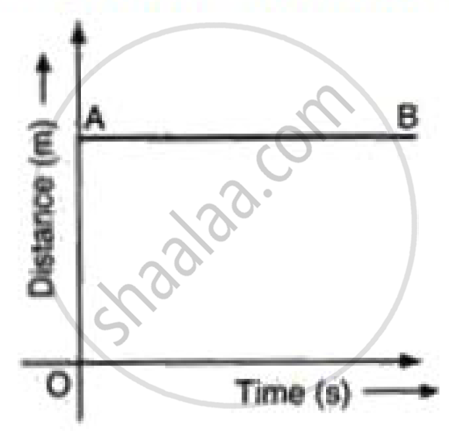
Mention the uses of the velocity-time graph.
