Advertisements
Advertisements
प्रश्न
Three speed-time graphs are given below :
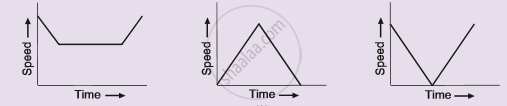
Which graph represents the case of:
(i) a cricket ball thrown vertically upwards and returning to the hands of the thrower ?
(ii) a trolley decelerating to a constant speed and then accelerating uniformly ?
Advertisements
उत्तर
(i) Graph (c) represents a cricket ball thrown vertically upwards and returning to the hands of the thrower.
(ii) Graph (a) represents a trolley decelerating to a constant speed and then accelerating uniformly.
APPEARS IN
संबंधित प्रश्न
A car of mass 1000 kg is moving with a velocity of 10 m s−1. If the velocity-time graph for this car is a horizontal line parallel to the time axis, then the velocity of car at the end of 25 s will be :
What does the slope of a displacement-time graph represent?
What does the area of an acceleration – time graph represent?
Diagram shows a velocity – time graph for a car starting from rest. The graph has three sections AB, BC, and CD.

Is the magnitude of acceleration higher or lower than that of retardation? Give a reason.
What can you conclude if the speed-time graph of a body is a curve moving upwards starting from the origin?
Draw the following graph:
Distance versus time for a body at rest.
What can you say about the nature of motion of a body of its displacement-time graph is:
A straight line parallel to line axis?
Draw distance-time graph to show:
Increasing velocity
State whether true or false. If false, correct the statement.
The velocity – time graph of a particle falling freely under gravity would be a straight line parallel to the x axis.
A straight line parallel to the x-axis in the velocity-time graph represents the object moving in ______.
