Advertisements
Advertisements
प्रश्न
A car of mass 1000 kg is moving with a velocity of 10 m s−1. If the velocity-time graph for this car is a horizontal line parallel to the time axis, then the velocity of car at the end of 25 s will be :
पर्याय
25 m s−1
40 m s−1
10 m s−1
250 m s−1
Advertisements
उत्तर
It is given that the velocity time curve is parallel to x axis hence velocity is constant with time and acceleration is 0. So, the answer is
(c) 10 m s−1
APPEARS IN
संबंधित प्रश्न
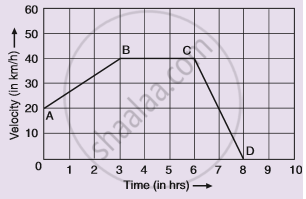
Given alongside is the velocity-time graph for a moving body :
Find :
(i) Velocity of the body at point C.
(ii) Acceleration acting on the body between A and B.
(iii) Acceleration acting on the body between B and C.
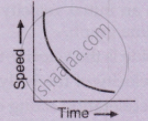
What type of motion is represented by the following graph ?
Draw a displacement-time graph for a boy going to school with uniform velocity.
Diagram shows a velocity – time graph for a car starting from rest. The graph has three sections AB, BC and CD.
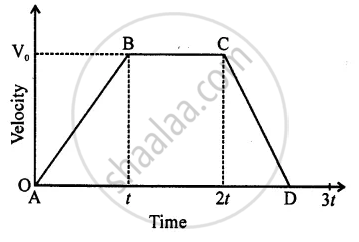
From a study of this graph, state how the distance travelled in any section is determined.
Figure shows the velocity-time graphs for two objects A and B moving in same direction . Which object has the greater a cceleration?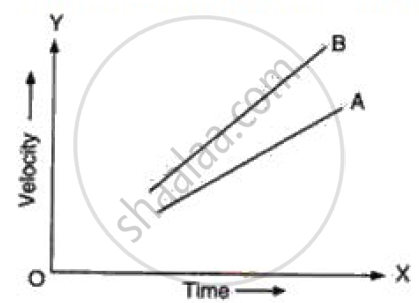
Derive the equation
S = ut+ `1/2` at2
Using a speed- time graph
State whether true or false. If false, correct the statement.
The velocity – time graph of a particle falling freely under gravity would be a straight line parallel to the x axis.
Mention the uses of the velocity-time graph.
From the v-t graph, ______ can be calculated.
If the velocity-time graph has the shape AMB, what would be the shape of the corresponding acceleration-time graph?

