Advertisements
Advertisements
Question
A car of mass 1000 kg is moving with a velocity of 10 m s−1. If the velocity-time graph for this car is a horizontal line parallel to the time axis, then the velocity of car at the end of 25 s will be :
Options
25 m s−1
40 m s−1
10 m s−1
250 m s−1
Advertisements
Solution
It is given that the velocity time curve is parallel to x axis hence velocity is constant with time and acceleration is 0. So, the answer is
(c) 10 m s−1
APPEARS IN
RELATED QUESTIONS
What does the slope of a speed-time graph indicate ?
The velocity-time graph for part of a train journey is a horizontal straight line. What does this tell you about the trains velocity.
Three speed-time graphs are given below :
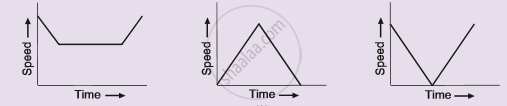
Which graph represents the case of:
(i) a cricket ball thrown vertically upwards and returning to the hands of the thrower ?
(ii) a trolley decelerating to a constant speed and then accelerating uniformly ?
Draw a displacement-time graph for a boy going to school with uniform velocity.
Draw a velocity-time graph for the free fall of a body under gravity starting from rest. Take g = 10m s-2
Diagram shows a velocity – time graph for a car starting from rest. The graph has three sections AB, BC, and CD.
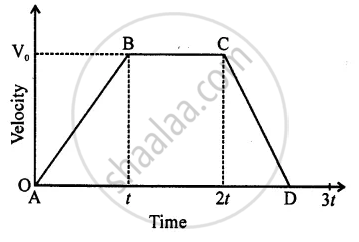
Is the magnitude of acceleration higher or lower than that of retardation? Give a reason.
Represent the location of an object described as at 15 m, 45o west of north, on a graph paper.
What can you conclude if the speed-time graph of a body is a curve moving upwards starting from the origin?
What can you say about the nature of motion of a body of its displacement-time graph is:
A straight line inclined to the time axis with an acute angle?
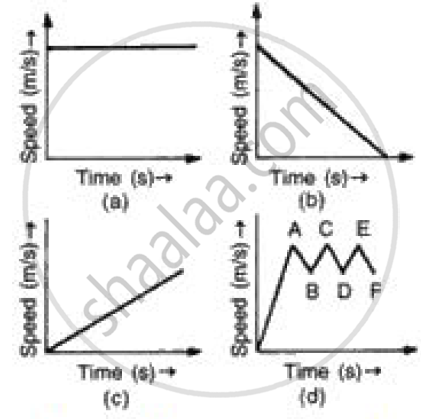
(i) In speed time graph uniform motion is given by a straight line parallel to x axis so figure (a) denotes the uniform motion.
(ii) In speed time graph motion with increasing speed is shown by straight line with positive slope so figure (c) denotes the motion with speed increasing.
(iii) In speed time graph motion with decreasing speed is shown by straight line with negative slope so figure (b) denotes the motion with speed decreasing.
(iv) In speed time graph motion with oscillating speed is shown by zigzag line so figure {d) denotes the motion with speed oscillating.
